

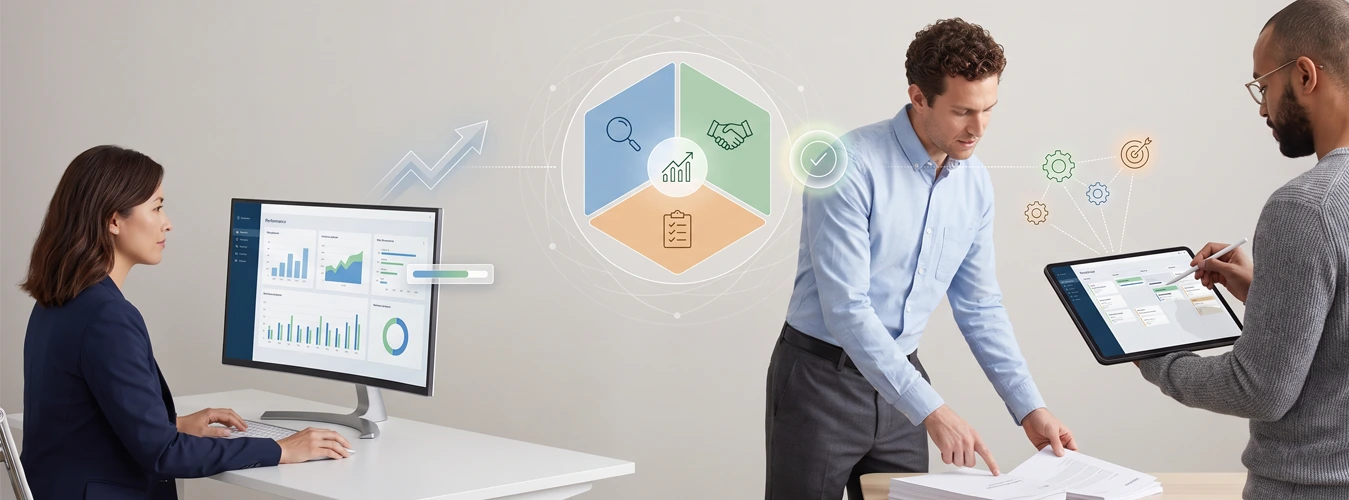

It is a fact that the traditional way of looking at productivity is not essentially correct.
For decades, managers relied on the “butt-in-seat” metric. If you were at your desk from 9 to 5, you were working. But the modern workplace, especially with the rise of remote and hybrid work, has blown that theory out of the water.
If you try to measure a software developer by how many lines of code they write, they’ll write messy code just to hit a number. If you measure a salesperson by the number of calls they make, they’ll call people who will never buy. And if you measure a customer support rep by how fast they get people off the phone, you’re going to get a lot of angry customers.
The truth is, employee productivity tracking isn’t about surveillance; it’s about clarity. It’s about defining what “good” looks like for specific roles.
One size fits none. To get a real pulse on your team’s performance, you need a scorecard that adapts to the job. Here is how to build a productivity scorecard for different job roles without losing your mind or your team’s trust.
Step 1: The Foundation (Before You Build Anything)
Before you start plugging in metrics, you need a philosophy. A scorecard shouldn’t be a weapon; it should be a compass.
If your team feels like they are being watched for the sake of being watched, they will game the system. You need to frame employee productivity tracking as a tool for empowerment. It helps them see their wins and identifies where they need support. Once you have that buy-in, you can start building.
Step 2: The Scorecard Breakdown by Role
Different jobs have different “outputs.” Here is how to structure a scorecard for the three main archetypes of work.
1. The Creators (Developers, Designers, Writers)
Measuring creative or complex problem-solving work is the hardest part. You can’t rush art, but you also can’t let deadlines slip forever.
- Bad Metric: Hours logged online.
- Good Metrics:
- Cycle Time: How long does it take to go from “started” to “done”? (This measures efficiency).
- Quality/Speed Ratio: How many bugs were reported after a feature release? (This measures quality).
- Peer Review Feedback: Are their contributions moving the project forward?
For these roles, focus on outcomes, not activity. A designer might spend four hours staring at a wall and then create a masterpiece in one hour. If you track keystrokes, you’ll punish the thinking phase. Use project management tools to track task completion and quality assurance metrics.
2. The Closers (Sales, Business Development)
One of the easiest roles to measure is Sales. This is because the output is binary: did they sell or not? However, relying only on revenue can be demoralizing during a dry spell.
- Bad Metric: Number of cold calls (quantity over quality).
- Good Metrics:
- Conversion Rate: Leads to closed deals.
- Sales Cycle Length: How fast do they move a prospect through the pipeline?
- Customer Lifetime Value (CLV): Are they selling to people who stay, or just selling to hit a quota?
Sales scorecards should be a mix of leading and lagging indicators. Revenue is a lagging indicator (the result). Calls, emails, and demos are leading indicators (the effort). Balance the scorecard by weighting revenue at 60% and activity metrics at 40% to encourage consistent effort.
3. The Caretakers (Customer Support, Success, Admin)
These roles are the heartbeat of your retention, but they are often undervalued because their work is reactive.
- Bad Metric: Average handle time (AHT). If you rush a customer, they churn.
- Good Metrics:
- Customer Satisfaction (CSAT): The gold standard.
- First Contact Resolution: Did they solve the problem on the first try?
- Ticket Backlog: How many open issues are they managing?
For support roles, the scorecard should balance speed with empathy. If you only measure speed, you get robotic service. If you only measure satisfaction, you might get slow service. Aim for a balance where the employee feels rewarded for solving the problem, not just ending the conversation.
Step 3: The Golden Rule – Mix Quantitative and Qualitative
Data is great. Data is objective. But data lacks context.
If an employee has a terrible month on their scorecard, is it because they are slacking, or because their mother was in the hospital?
A robust scorecard should always include a qualitative component. This could be a monthly 1-on-1 review where the manager and employee discuss the “why” behind the numbers. This is where employee productivity tracking moves from data collection to people management.
Step 4: Choose the Right Tools
You cannot manage what you do not measure. But you also shouldn’t spend your entire day copying and pasting data into Excel sheets.
You need a system that automates the data collection so you can focus on the analysis. Whether it’s integrating with your CRM for sales or your helpdesk software for support, the tool should do all the heavy work.
This is where an employment productivity tracking platform comes into play. It gives you the flexibility to streamline how you track tasks and time without micromanaging. It gives you the visibility you need to build these scorecards based on real data, not guesswork.
Step 5: Review and Iterate
The first version of your scorecard will probably be wrong. That’s okay.
Maybe you realize that a specific metric for your marketing team is encouraging clickbait rather than quality leads. Maybe you realize your developers are spending too much time updating tickets and not enough time coding.
Treat the scorecard as a living document. Review it quarterly with your team. Ask them: “Does this accurately reflect your hard work?” If the answer is no, tweak it.

Last Word
Building an employee productivity scorecard isn’t about finding a magic number that proves someone is working. It’s about creating a framework for fair, transparent, and role-specific expectations.
When you customize your scorecard to the reality of the job, whether that’s creative, sales, or support, you stop managing activity and start managing results. You empower your team to focus on what actually matters.
Stop guessing and start tracking what counts. Visit Handdy today to discover how our tools can help you build smarter, fairer productivity scorecards for your entire team.
FAQ
1. What is an employee productivity scorecard?
An employee productivity scorecard is a performance measurement framework that uses role-specific KPIs, work quality, and business outcomes to evaluate employee productivity fairly.
2. How do you measure employee productivity across different job roles?
Measure productivity using metrics suited to each role. Developers can be evaluated by code quality and delivery time, sales teams by conversion rates and revenue, and customer support teams by customer satisfaction and first-contact resolution.
3. What are the best KPIs for an employee productivity scorecard?
The best KPIs depend on the job. Common examples include task completion rate, cycle time, quality of work, sales conversion rate, customer satisfaction, and first-contact resolution.
4. Can employee productivity tracking software help build a productivity scorecard?
Yes. Employee productivity tracking software can provide visibility into work hours, activity patterns, and time usage. Managers can combine these insights with role-specific KPIs and qualitative feedback to evaluate performance more accurately.
5. How can businesses track employee productivity without micromanaging?
Businesses can set transparent expectations, focus on outcomes rather than constant activity, use relevant performance metrics, and conduct regular employee reviews. Productivity tracking should support better decisions and identify where employees need help, not simply monitor their every move.