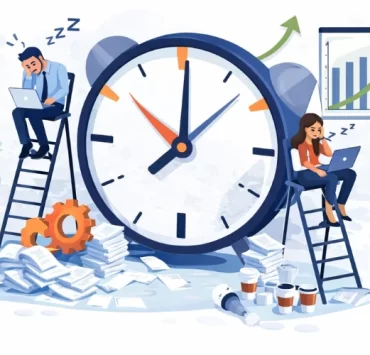
Most failed projects weren’t short on hours logged. They were short on the right signals and nobody caught them in time.
That’s the uncomfortable truth sitting behind billions of dollars in missed deadlines every year. According to a 2017 report of the Project Management Institute, only organizations with high project management maturity see 67% of their projects meet goals and business intent. The rest? They’re flying on gut feel and hour counts. Timesheets tell you when people worked. They say almost nothing about whether the work is working.
So what actually predicts whether a project will succeed before it’s too late to course-correct? Here are five metrics that do the heavy lifting that timesheets never could.
1. Schedule Variance (Not Just Deadline Miss)
There’s a difference between a project being late and a project being structurally broken. Schedule Variance (SV), the gap between planned progress and actual progress at any given moment tells you which one you’re dealing with.
A team that’s 10% behind on week two of a 12-week project is in a very different position than a team that’s 10% behind on week ten. Tracking Schedule Variance in real time lets managers identify the pattern of slippage, not just the end-of-project disaster. Milestone completion rates tracked against original estimates reveal whether the project’s baseline assumptions were ever realistic to begin with.
2. Active vs. Idle Time Ratio
Here’s a metric that makes people uncomfortable, and for good reason. The ratio of genuinely active work time to idle or unproductive time inside a project isn’t about surveillance. It’s about signal quality.
When a team logs eight hours but only three of those hours show meaningful task engagement, something structural is broken – unclear task ownership, tool friction, or workflow bottlenecks. Employee monitoring software tracks active vs. idle time across tasks and applications, giving managers an objective map of where work actually stops. Teams with visibility into this pattern can redesign workflows before productivity loss compounds into deadline failure.
3. Task Completion Velocity
Velocity is borrowed from agile development, but it belongs in every project framework. It measures how many units of work (tasks, tickets, deliverables) a team completes per time period. When velocity drops mid-project without a change in scope, something has gone wrong upstream.
The power of this metric isn’t the number itself, it’s the trend line. A steadily declining velocity in week four is an early warning system for a project-killing bottleneck in week seven. Monitoring task completion patterns using project management platforms and productivity tools gives you that trend line in time to act on it.
4. Stakeholder Satisfaction Score (Mid-Project, Not Post-Mortem)
This one almost nobody tracks while the project is alive. Most teams collect stakeholder feedback after delivery which is about as useful as reading the flight recorder after the crash.
Research from the 2024 State of Project Management report found that customer satisfaction ranked among the top five performance themes that correlated most strongly with project success. The problem is that satisfaction is treated as an outcome rather than an input. A quick mid-project pulse survey, even five questions, can surface misalignment in expectations before it becomes a contract dispute. Strategic alignment with stakeholder needs is a primary catalyst for project success, increasing the probability of high customer satisfaction by over 50%.
5. Work Distribution Inequality (The Burnout Predictor)
On most projects, work doesn’t fall evenly. A handful of people carry a greater load, say nothing because they’re “team players,” and then quietly burn out or exit two weeks before go-live. This pattern destroys projects that look healthy on paper.
Monitoring how tasks are distributed across team members, who owns how much, who is consistently overloaded, who is under-utilized, is one of the most underused predictive metrics in project management. Modern employee monitoring software flags these imbalances by analyzing workload distribution and output patterns, allowing team leads to rebalance before a key contributor hits the wall. An even distribution isn’t just fair; it’s a structural risk management strategy.
The Common Thread
None of these five metrics show up on a timesheet. But all of them show up in the data trail that work leaves behind – the apps used, the tasks completed, the time spent actively versus passively, the communication cadence with stakeholders.
The most successful project teams in 2025 aren’t managing more, they’re measuring smarter. They’ve moved from “Did everyone log their hours?” to “Does the data tell us this project will succeed?”
Handdy’s employee monitoring software gives you exactly that visibility – active time tracking, task completion insights, workload distribution analytics, and real-time productivity signals, all in one place. If your project management still starts and ends with timesheets, it’s time to upgrade the instruments, not just the intentions.
Try Handdy and start measuring what actually matters.
Frequently Asked Questions
1. What is Schedule Variance and how is it different from just missing a deadline?
Schedule Variance (SV) measures the gap between planned progress and actual progress at any given moment during a project. Unlike a deadline miss — which you only discover at the end — SV flags structural slippage early, giving managers time to course-correct before it becomes a full project failure.
2. Is tracking active vs. idle time about spying on employees?
No — active vs. idle time tracking is about identifying workflow problems, not monitoring individuals. When meaningful task engagement drops significantly within logged hours, it usually signals unclear task ownership, tool friction, or bottlenecks. The goal is to fix broken workflows before productivity loss compounds into missed deadlines.
3. Why should stakeholder satisfaction be measured during the project and not just after delivery?
Post-delivery feedback is too late to act on. Mid-project pulse surveys — even just five questions — can surface expectation misalignments before they become contract disputes. Research from the 2024 State of Project Management report shows that strategic alignment with stakeholder needs increases the probability of high customer satisfaction by over 50%.
4. How does work distribution inequality lead to project failure?
When a handful of team members carry a disproportionate workload, they often stay silent to appear like “team players” — until they burn out or exit close to the go-live date. Monitoring workload distribution helps team leads rebalance tasks early, turning fairness into a structural risk management strategy.
5. How does Handdy help teams track these five predictive project metrics?
Handdy’s employee monitoring software provides active time tracking, task completion insights, workload distribution analytics, and real-time productivity signals — all in one platform. Instead of relying solely on timesheets, Handdy gives project managers the data visibility needed to predict success before problems escalate.